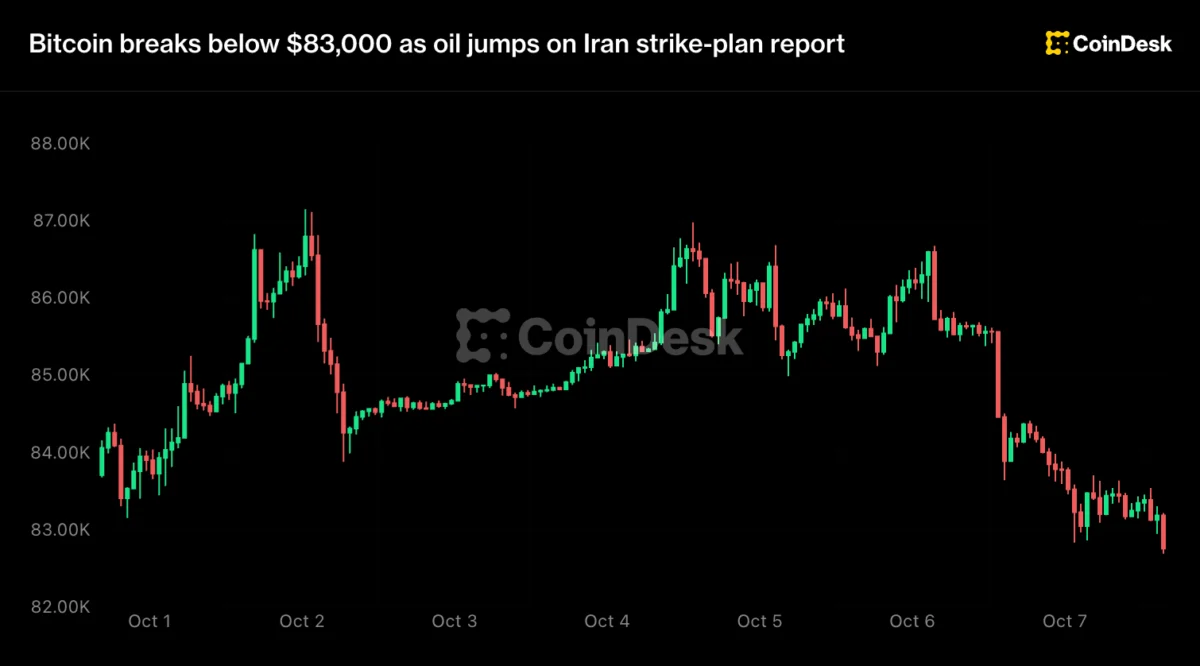







Bitcoin (BTC) experienced a deeper pullback during Wednesday’s Wall Street market open, pressured by a sharp rise in global crude oil prices stemming from escalating US-Iran geopolitical headlines and a broader cooling of traditional equities from their all-time highs.
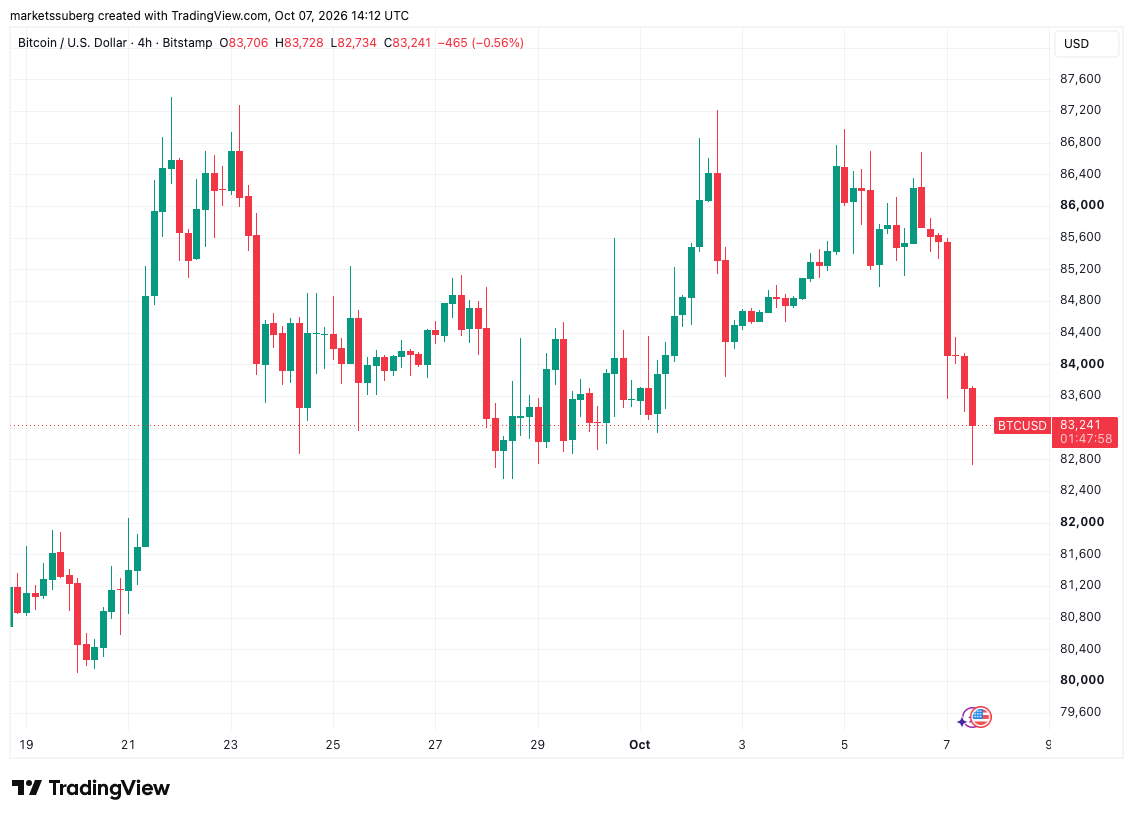
Data provided by TradingView captured the bellwether cryptocurrency dipping beneath the $83,000 threshold, thereby establishing fresh month-to-date lows. The downward trajectory arrived alongside mixed signals regarding critical maritime oil transit through the Strait of Hormuz, an event that instantly sent shockwaves through international commodity markets, traditional fixed-income securities, and risk-on asset classes alike.

Bond yields set new 24-year high on Iran oil clampdown
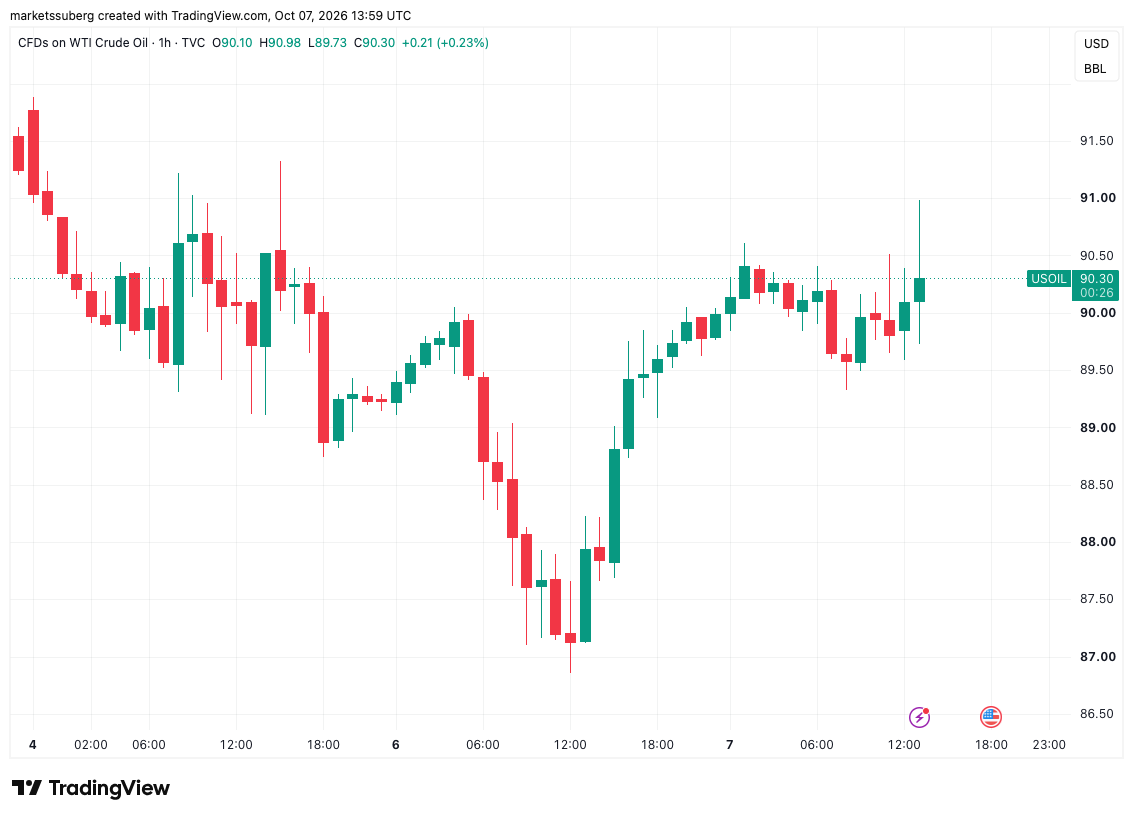
The geopolitical flashpoint centered on conflicting reports and warnings surrounding oil traffic through the vital Strait of Hormuz. These developments catalyzed a rapid rally in energy commodities, pushing Brent crude oil up to $102 per barrel on the day, while West Texas Intermediate (WTI) crude climbed to $91 per barrel.
Fueling the market anxiety, an adviser to the commander of Iran’s Islamic Revolutionary Guard Corps, as quoted by Reuters, issued a stark warning regarding an impending clampdown on maritime traffic that authorities had deemed illegal.
"The Strait of Hormuz is closed, and the armed forces of the Islamic Republic of Iran have full control over it. This situation will continue until Iran’s legitimate demands are met," the official stated.
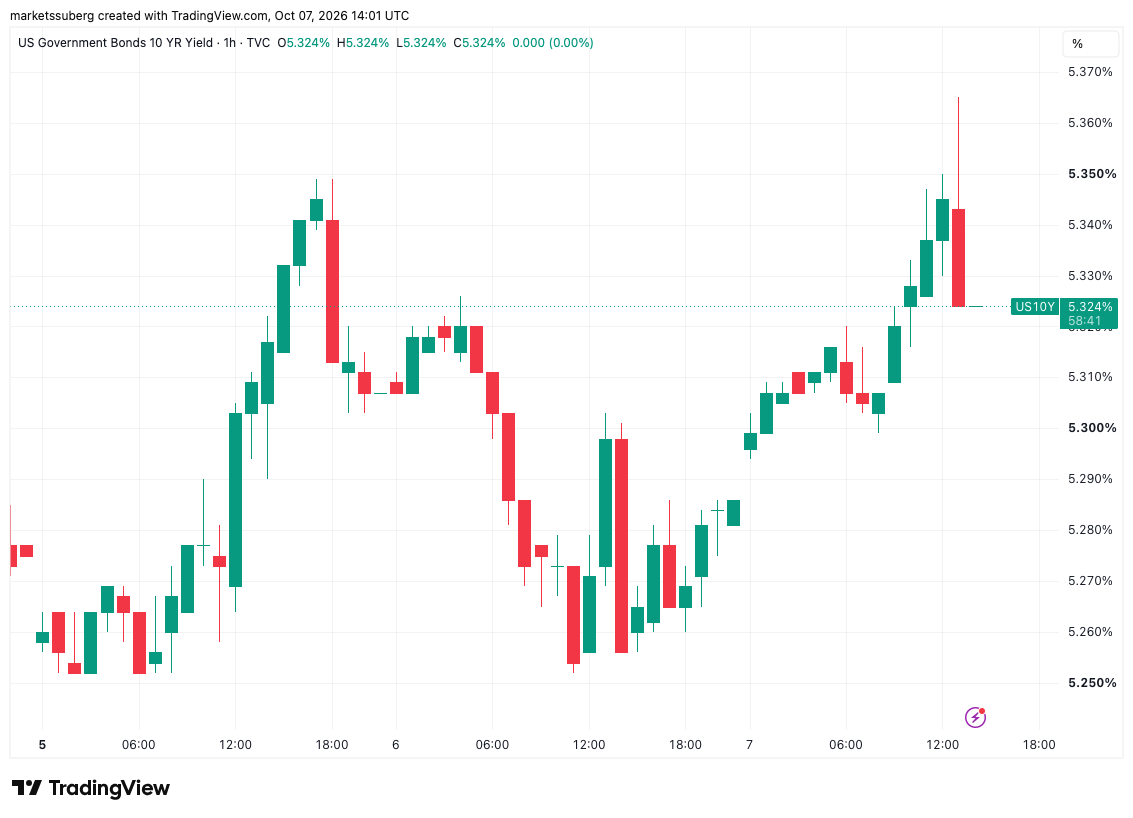
The immediate fallout spilled aggressively into traditional sovereign debt markets. United States bond yields, which historically exhibit high sensitivity to macro concerns surrounding persistent inflation and mounting government debt loads globally, reacted with dramatic upward momentum. Consequently, US bond yields vaulted to new 24-year highs, with the benchmark 10-year and 30-year Treasury yields touching 5.36% and 5.73%, respectively.
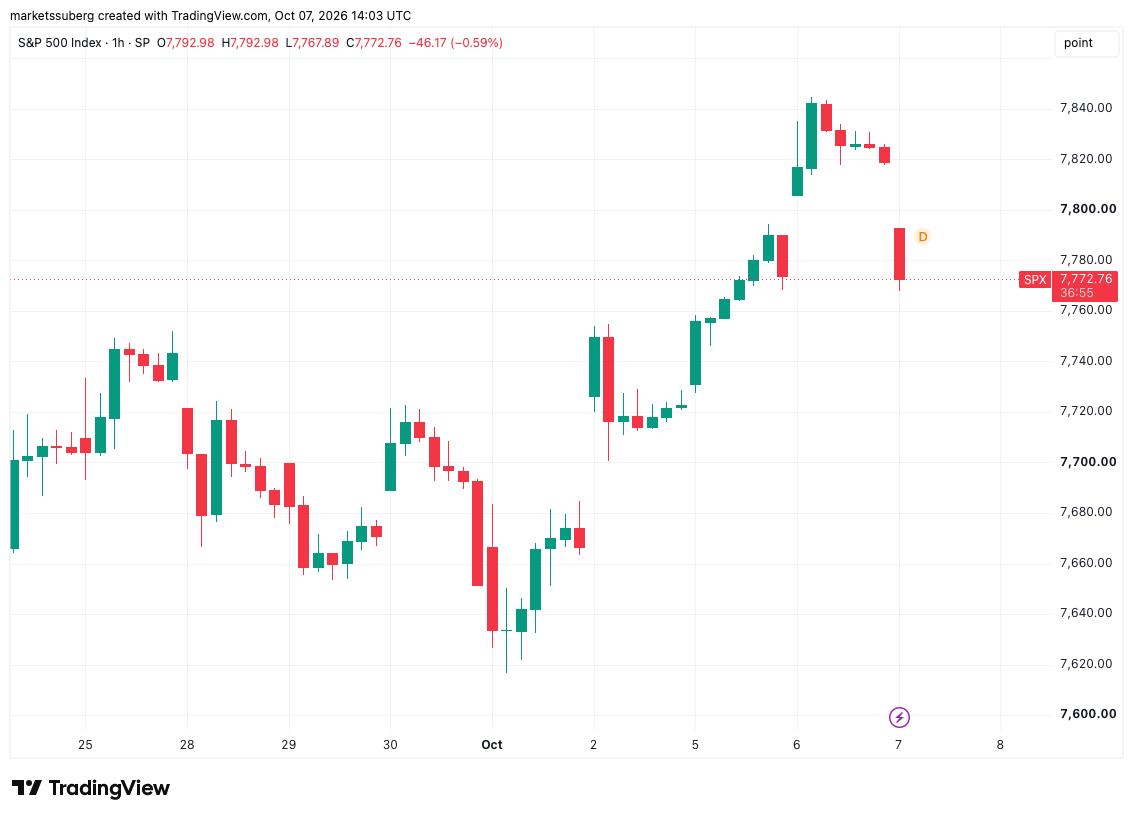
Simultaneously, US stock markets pivoted lower following a brief foray into record territory. Just a day after hitting fresh all-time highs, major equity indices retreated as macroeconomic headwinds intensified. The benchmark S&P 500 index traded down 0.6% on the session, settling at 7,773 points.
Providing broader context to the fixed-income reaction, Muhammad Qubbaj, co-head of North America interest rate product sales and trading at Goldman Sachs FICC and Equities, shared insights during a recent webinar. He predicted that sovereign yields would likely remain under continuous pressure moving forward, driven largely by elevated energy prices and subdued demand from institutional investors. Qubbaj explicitly forecast that rising oil prices would likely serve as the primary driving factor for longer-term interest rates in the near-to-medium term.
Bitcoin demand lacking as upside momentum fades
Within the digital asset ecosystem, Bitcoin’s inability to clear overhead resistance played a significant role in the severity of the correction. Market analysts pointed out that BTC has continuously struggled to break through stubborn ask liquidity clustering around the $87,000 mark. This persistent ceiling has consequently highlighted a noticeable waning of demand across both spot and derivatives markets.
Onchain and derivatives analytics have increasingly reflected this lack of aggressive participation from market participants. According to a report published by onchain analytics platform CryptoQuant, Bitcoin has remained trapped in a relatively narrow range since September 22. During this same flat-lining price period, Bitcoin Open Interest experienced a notable contraction, declining by nearly 10% from approximately $28.8 billion down to $26.0 billion.
CryptoQuant noted that this contraction suggests that alongside subdued spot market demand, futures traders have likewise demonstrated a limited willingness to absorb or take on additional risk in the current macroeconomic climate.
The descent toward the $83,000 level also effectively invalidated foundational technical support that had previously been reinforced by Bitcoin’s 21-day simple moving average (SMA), which stood at $83,850. CryptoQuant analysts added that looking ahead toward higher time frames, the $69,500 region remains a critical metric worth closely monitoring, as it represents the aggregate average cost basis for Bitcoin short-term holders—defined as entities holding a given allocation without distribution for up to six months.