







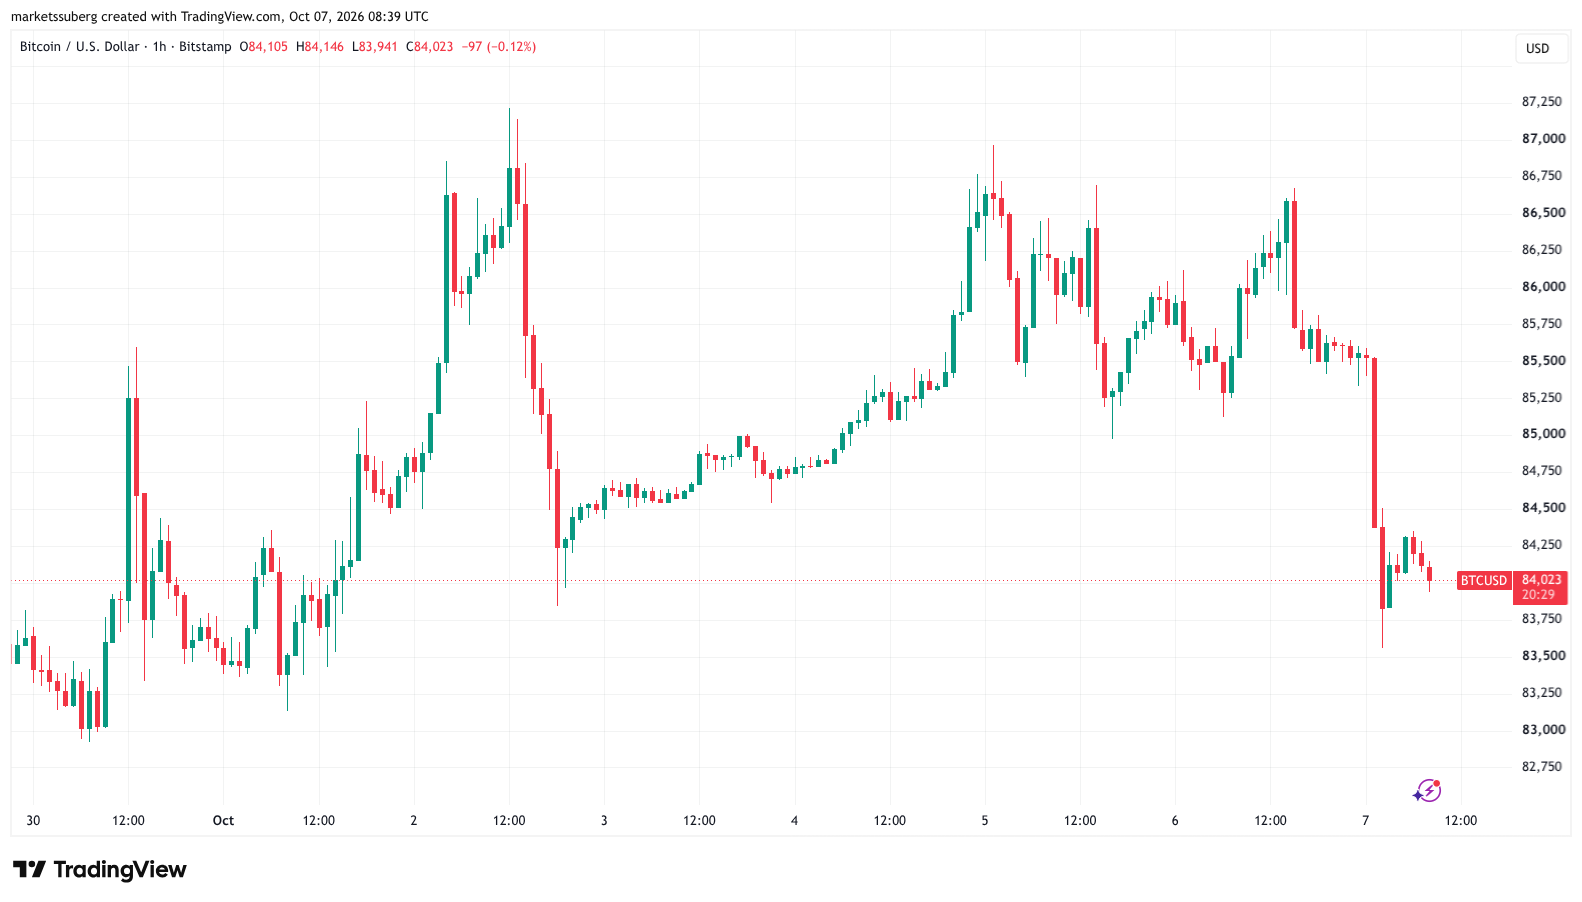
Bitcoin dipped below the $84,000 threshold on Wednesday, triggering a sharp wave of market volatility that wiped out more than $500 million in leveraged cryptocurrency long positions within a 24-hour window. The sudden downward pressure interrupted a period of steady upward momentum and brought short-term trading dynamics sharply into focus as analysts weighed the health of broader macroeconomic and technical indicators.
According to market data from TradingView, the BTC/USD trading pair experienced a sudden contraction of up to 2.3% across two consecutive hourly candles. Following the steep flash correction, the leading cryptocurrency managed to partially retrace its steps, hovering near the $84,000 mark at the time of reporting.

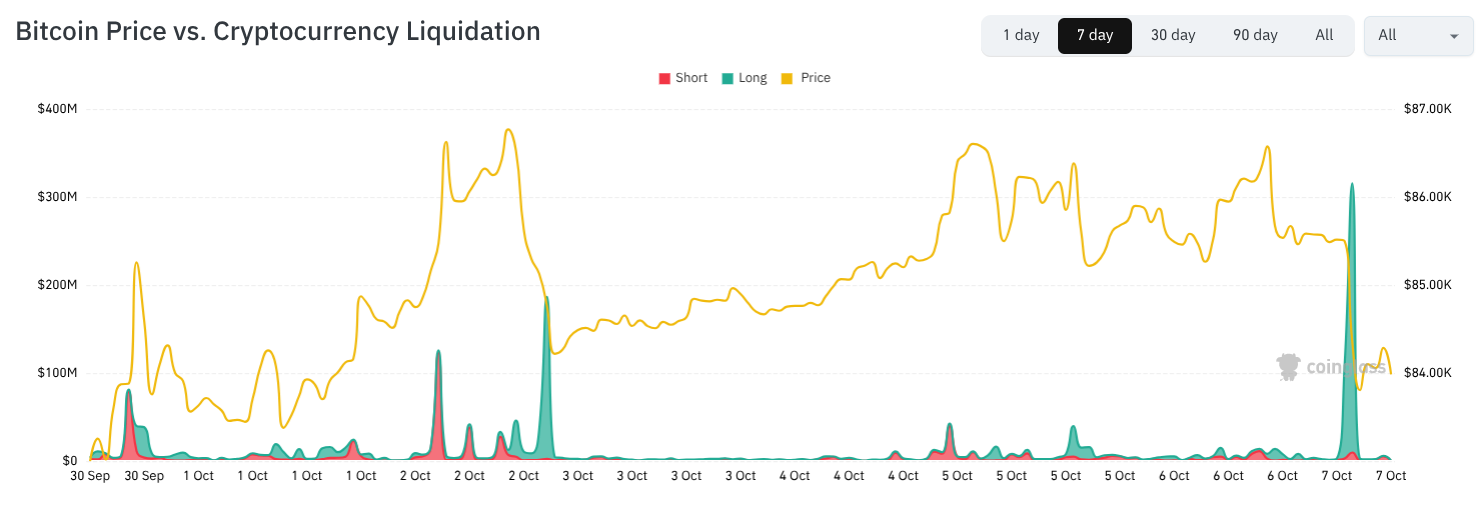
The abrupt correction followed a period of intense congestion near the top of the order books. Overhead ask liquidity had thickened significantly on centralized exchanges throughout Tuesday, effectively capping the spot price and preventing it from breaking past the $86,500 resistance level. As bullish momentum stalled against this formidable wall of sell orders, a rapid cascade of liquidations ensued. Cumulative 24-hour crypto long liquidations surged past $550 million, according to metrics compiled by CoinGlass, catching many leveraged market participants off guard.
Amid the broader market turbulence, specific derivatives activity drew intense scrutiny from onchain analysts. Just hours before the overnight price drop, onchain tracking data highlighted by analytics platform Lookonchain revealed that four distinct wallets utilized USD Coin (USDC) to establish aggressive short positions. These traders deployed 40x leverage against 148.49 Bitcoin on the Hyperliquid derivatives platform, successfully betting against the near-term resilience of the asset.
Despite the heavy flushing of long positions, market participation quickly showed signs of recovery. Open interest across the 21 major derivatives exchanges tracked by CoinGlass began an immediate rebound, suggesting that institutional and retail traders remained comfortable re-establishing exposure at local market lows. Data shows that open interest expanded from approximately $54.2 billion to $55.3 billion over a tight six-hour window between 4 a.m. and 10 a.m. UTC.
Bitcoin Preserves Nearby Support Levels
Even with the daily retracement pushing prices roughly 1.8% lower, Bitcoin successfully managed to defend critical foundational support. The asset respected its 21-day simple moving average (SMA), which sits near $83,850. Market observers previously identified this specific moving average as a vital line in the sand for bullish traders operating on lower time frames, providing a temporary floor during periods of acute selling pressure.
Directly below this primary trend line, the $82,500 region remains a decisive area for Bitcoin’s broader macroeconomic uptrend. This price tier serves as a structural component within an inverse head-and-shoulders reversal pattern that continues to develop on the weekly chart. The market last tested this specific psychological and technical zone on Sept. 28, making its defense crucial for maintaining long-term bullish sentiment.
In his latest market commentary shared with followers on the social media platform X, prominent trader and analyst Rekt Capital emphasized that the market still requires a firm daily candle close above $86,700 to sustainably validate the continuation of the broader bullish setup.
"At the moment, Bitcoin is lacking that lower timeframe confirmation relative to this key level for continuation," Rekt Capital noted in his Tuesday market analysis.
The interplay between shifting exchange liquidity, massive derivatives leverage flushes, and key moving averages highlights the delicate equilibrium currently governing the cryptocurrency markets. As Bitcoin tests crucial local supports while broader chart patterns continue to play out, market participants remain closely attuned to upcoming daily closes and macro economic signals to determine the next decisive directional move.