





Bitcoin’s historical reputation for a dismal September is being put to the test once again. Driven by volatile macroeconomic conditions, shifting regulatory news, and dynamic institutional capital flows, the world’s leading cryptocurrency is hovering near a historic milestone. Yet, market analysts caution that whether this month marks a permanent structural break in traditional seasonality or is merely a temporary deviation fueled by modern financial instruments remains a heavily debated question.
As the month draws to a close, Bitcoin has gained approximately 7.3% through September 29, positioning itself just ahead of September 2024’s impressive 7.29% return. According to comprehensive data aggregated by CoinGlass, this performance places the asset firmly on track for its strongest September in recorded history, provided it clears a final, razor-thin hurdle.
Securing this record requires a monthly close above approximately $83,600 on September 30. Trading at around $83,300 just hours before the monthly candle closes, the market sits on a knife-edge. Should it succeed, it would mark the fourth consecutive positive September in Bitcoin’s history—an unprecedented streak that defies the asset’s long-standing seasonal trends. However, market observers emphasize that a conditional record and the modern influence of spot exchange-traded funds offer no definitive proof that the underlying behavioral patterns of the market have fundamentally altered.
What a Green September Could Mean for the Wider Market and Q4
For years, September has worn the crown of the most hostile month for digital assets. Historical data compiled by CoinGlass reveals that Bitcoin closed lower in eight out of the 13 years spanning from 2013 to 2025. Across that timeframe, the asset suffered an average September return of -2.34%. The narrative of the "September curse" was further solidified between 2017 and 2022, a grueling stretch that saw six consecutive years of red Septembers.
However, the tide began to subtly shift in recent years. The pattern of consecutive losses was broken when September posted positive returns of 3.91% in 2023, followed by 7.29% in 2024, and 5.16% in 2025. If 2026 ultimately prints another green monthly candle, it will stretch the current winning streak to four consecutive years—the longest run of positive Septembers on record.

While such an outcome strongly challenges the enduring bearish narrative associated with the early autumn period, seasoned analysts warn against reading too much into the data. Even if 2026 secures the top spot, its returns will only marginally exceed those of 2024. This incremental outperformance provides a shaky foundation for claims that historical calendar effects have vanished entirely. Instead, analysts are looking closely at how structural market additions, such as spot Bitcoin ETFs, interact with traditional macro cycles to shape modern price action.
ETF Flows and Policy Shocks Drove September’s Reversal
The path to September’s current valuation was far from straightforward, characterized by sharp regulatory shocks and dramatic shifts in institutional liquidity. Bitcoin entered the month trading near $78,500, buoyed by a robust 25% rally through August. Yet, bullish momentum hit a sudden wall on September 15 when the United States Senate’s Clarity Act unexpectedly failed a crucial vote.
The legislative setback sent immediate shockwaves through the market, triggering $450.4 million in net outflows from spot Bitcoin ETFs within a single session. The incident served as a stark reminder of how rapidly shifting regulatory policies can alter institutional risk appetite and drain liquidity from the ecosystem.
Compounding the regulatory pressure, the Federal Reserve stepped in the following day on September 16, raising interest rates by 25 basis points to a target range of 3.75% to 4%. The combination of macroeconomic tightening and sudden ETF outflows dragged Bitcoin downward, testing support near the $75,000 threshold. The events vividly demonstrated that modern cryptocurrency price action cannot be analyzed in isolation from broader monetary policy and institutional financial pressures.
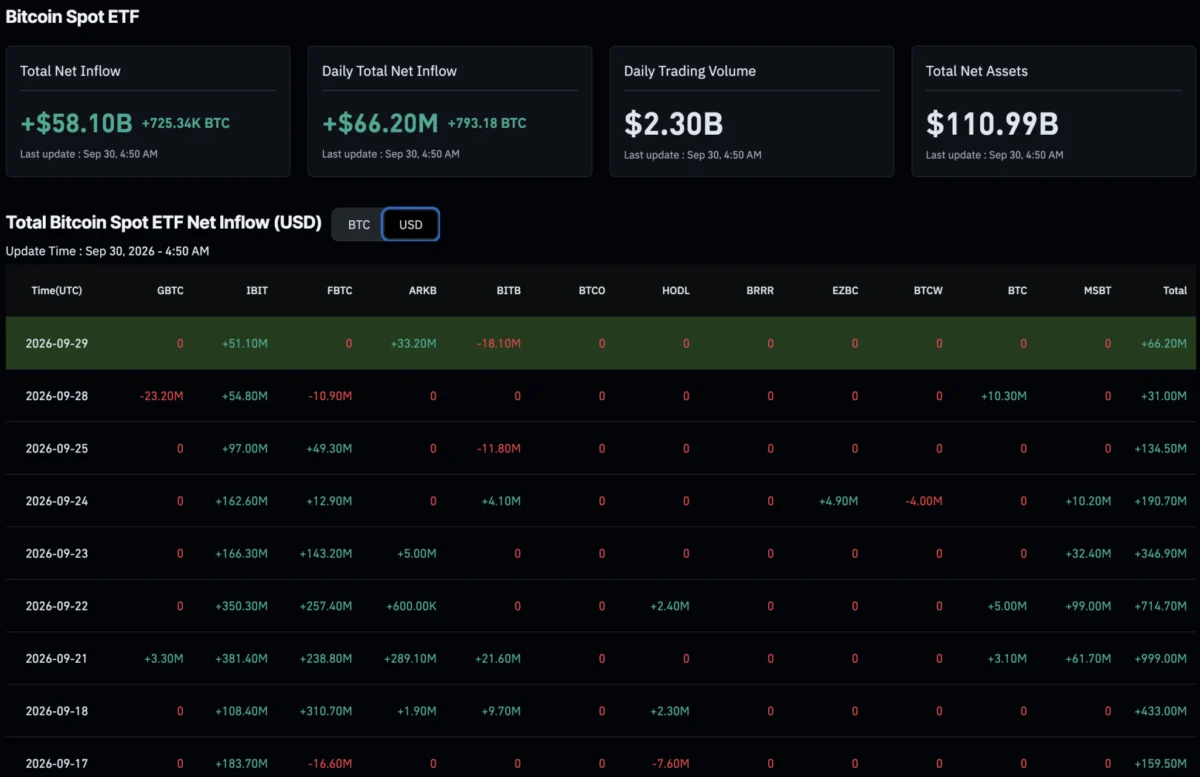
Nevertheless, the downward pressure proved short-lived as institutional demand roared back into the market. Spot Bitcoin ETFs experienced a dramatic reversal, capturing roughly $2.98 billion in net inflows across just seven trading sessions. Momentum peaked on September 21, when CoinDesk confirmed a staggering net inflow of $998.95 million—the highest single-day institutional intake recorded since October 2025.

As fresh capital poured into the market, Bitcoin staged a powerful recovery, surging to $87,354 to touch its highest price point since January. The aggressive upside move caught leveraged traders off guard, resulting in the liquidation of over $800 million in short positions. Although a subsequent profit-taking pullback trimmed roughly 4% from those local highs, the episode underscored the reality that fluctuating ETF flows offer a much more compelling explanation for modern market volatility than outdated seasonal calendars.
A Green Month Does Not Settle the Seasonal Question
As the monthly close approaches, technical indicators remain generally constructive despite recent volatility. Recent market reports highlight an Average Directional Index reading of 42.3 alongside a Relative Strength Index of 61.2, while the 50-day moving average continues to hold a bullish position above the 200-day moving average. Critical levels remain sharply in focus for traders, with $82,626 identified as an immediate pivot point and sturdy support resting between $81,166 and $79,705 should selling pressure resume.
Despite the resilience shown throughout the month, Bitcoin still trades roughly 4.4% below its opening price for 2026, which stood near $87,497. Looking further ahead into the calendar, historical precedent shows that strong September performances have frequently been followed by mixed results, and October’s historical average return of 19.92% offers no guarantees for the final months of the year.
Upcoming Federal Reserve policy meetings scheduled for October 27-28 and December 8-9 loom large on the horizon, threatening to inject renewed volatility into global risk assets. While macroeconomic conditions and ETF liquidity dynamics remain the primary drivers of Bitcoin’s near-term trajectory, September’s dramatic reversal highlights the unpredictable nature of institutional capital flows. Whether Bitcoin ultimately secures a record-breaking monthly close above $83,600 or falls just short, the narrow margin signifies a market that is actively challenging old patterns rather than abandoning them altogether.