





Bitcoin experienced a mild pullback on Wednesday, sliding to around $84,200 during early trading hours, yet the digital asset comfortably maintained its position within its recent consolidation channel. Despite retreating more than 2% from peaks near $86,500 established earlier in the week, market structure analysts note that the broader macro trend remains firmly intact, preserving a months-long bullish trajectory defined by successive waves of consolidation and impulsive breakouts.
The slight downward pressure observed midweek has done little to disrupt the prevailing technical formation that has characterized the cryptocurrency’s performance since the summer months. According to market data, the asset continues to respect the boundaries of the trading range it has occupied over the past fortnight, keeping alive a formation that seasoned traders and technical analysts refer to as a stair-step pattern.
Vikram Subburaj, CEO of Indian cryptocurrency exchange Giottus, emphasized that short-term corrections are a natural component of the ongoing market structure. Speaking on the broader implications of the mid-week price action, Subburaj noted that the October 7 decline does not invalidate Bitcoin’s stair-step rise. Instead, it represents standard market behavior within an established upward channel.
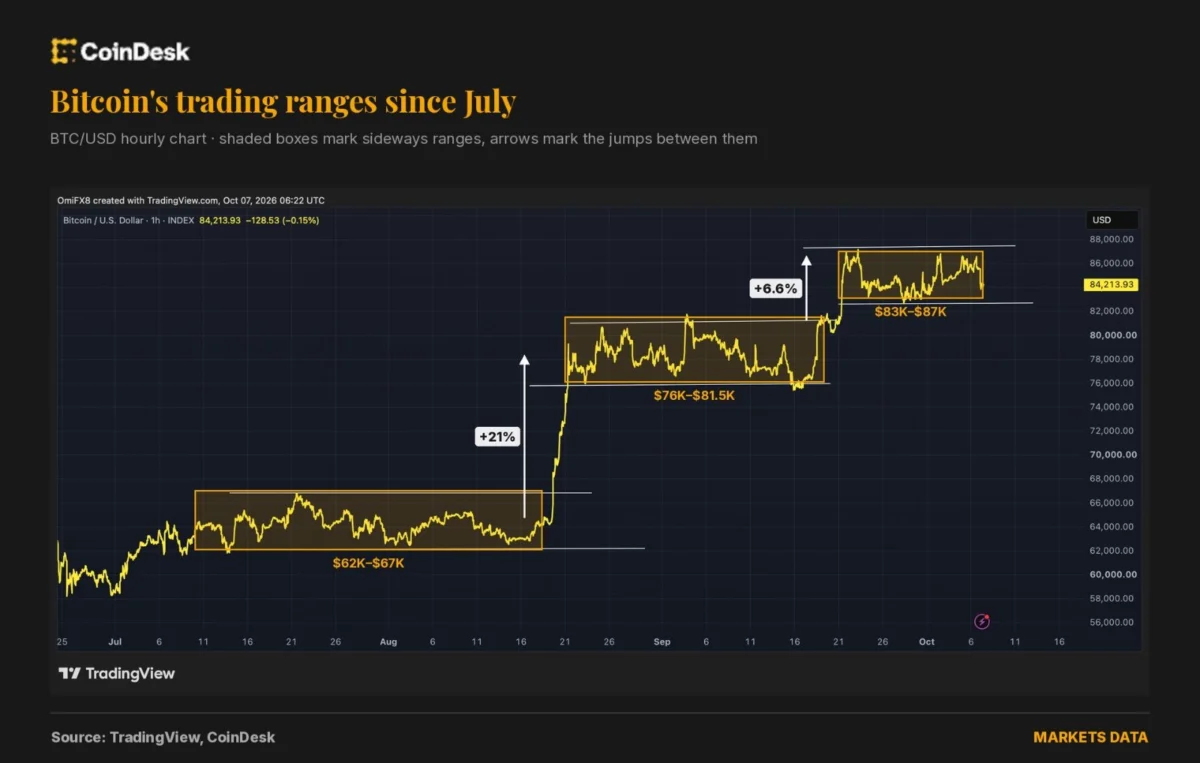
The mechanics of this stair-step progression have defined Bitcoin’s price discovery phase since July. Rather than advancing in a continuous, unbroken vertical rally, the cryptocurrency has historically favored a rhythm of sharp, explosive upward surges followed by extended periods of sideways accumulation. On a standard price chart, this behavior manifests as a distinct set of stairs, where the vertical risers represent rapid rallies and the flat horizontal sections correspond to weeks of range-bound trading where the market digests previous gains.
This pattern has repeated with notable precision over the preceding quarters. Between mid-July and August 18, Bitcoin traded within a relatively narrow and flat band of roughly $62,000 to $67,000. Once accumulation within that specific zone reached saturation, the cryptocurrency broke out forcefully, registering a striking 21% gain over the course of just three days.
A similar dynamic unfolded in the subsequent phase. From late August through mid-September, the market established a higher foundation, oscillating between approximately $76,000 and $81,500. This multi-week consolidation eventually gave way to another sudden market impulse, producing a clean 6.6% upward surge from September 19 to September 21. Following that breakout, Bitcoin successfully transitioned into its current operational band, maintaining a range between roughly $83,000 and $87,000.

This ability of the asset to establish successively higher trading bands is what underpins the confidence of long-term market participants. By holding above prior resistance levels, the cryptocurrency effectively converts former ceilings into reliable floors, signaling underlying demand and resilience against broader macro headwinds.
Looking closely at the current trading channel, market participants are closely monitoring the lower boundary to determine whether the existing structure will hold or if a deeper correction is imminent. Subburaj pointed out that following the move above $81,500, Bitcoin successfully carved out a new range of roughly $83,000 to $87,000. He explained that as long as the $83,000 threshold holds firm, it provides clear evidence that sellers lack the requisite conviction to force the price back down into its previous, lower trading band.
However, technical analysts remain vigilant regarding the specific price thresholds that would invalidate the current bullish architecture. The immediate level to watch on the downside remains anchored near $83,000. A definitive, sustained break below this critical support zone would effectively dismantle the stair-step pattern, halting the current bullish momentum, at least for the short term.
Further elaborating on the downside risks, Subburaj noted that a decisive drop below the $82,000 to $83,000 support bracket would signal that the breakout achieved in September has ultimately failed. Such a breakdown would inevitably reintroduce lower historical targets, bringing the $80,000 to $81,500 zone back into play as the market searches for a new equilibrium.
Other market observers share a similarly cautious yet structured view of the current support parameters. Alex Kuptsikevich, chief market analyst at FxPro, identified the immediate line of defense as resting slightly higher, positioning key support around the $84,000 mark. According to Kuptsikevich, a breach beneath this specific technical floor would swiftly open the door for a continuation of the downward move toward the psychological and structural $80,000 threshold.
Despite these potential downside scenarios and the mild retracement seen on Wednesday, the overarching sentiment among market analysts remains grounded in the broader perspective provided by the multi-month chart formations. As trading progressed through the middle of the week, the asset managed to stabilize, with Bitcoin hovering near $84,300. The ability of the cryptocurrency to absorb selling pressure and defend its established range underscores the resilience of the current market cycle as participants await the next definitive catalyst.